

TAM, SAM, and SOM The Founder's Guide for Calculating Market Size in 2026
21 min read
07 May 2026
By Aijaz Mughal
All startup pitches ultimately boil down to a single question: How big is your market, and how much of it can you actually capture? This is precisely where TAM, SAM, and SOM come in.
These three market sizing models assist founders in defining an opportunity at three levels. TAM represents the entire market potential, SAM represents the part that your business can actually serve, and SOM represents the share that you can actually win in the near future. The combination of them assists in converting a general market concept into a feasible growth plan.
The way you package these numbers influences the way investors, stakeholders, and your team will evaluate the business. TAM, SAM, and SOM are not only pitch deck metrics, but they also demonstrate that you know your market, can make realistic goals, and have a plausible growth trajectory. They also inform product, pricing, resource allocation, and expansion decisions by basing their strategy on actual market potential, beyond fundraising.
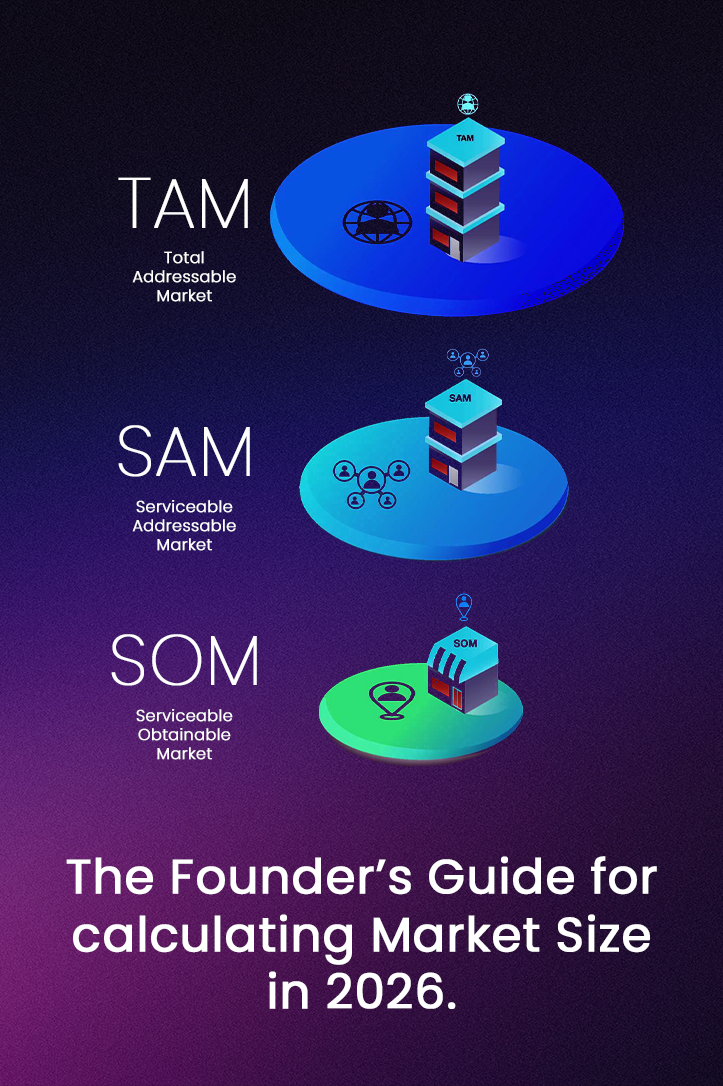
What Are TAM, SAM, and SOM?
These three acronyms are nested market-sizing measures that assist businesses and investors in understanding opportunities on various levels.
Total Addressable Market (TAM)
It is the total revenue potential if you had 100% of the market and no competition, and no restrictions. It is the widest possible perspective of your opportunity. Although no company can practically cover all of its TAM, this figure can be used to demonstrate that the market size is large enough to sustain a significant business.
Serviceable Addressable Market (SAM)
It focuses TAM on the segment of the market that you can practically serve given your business model, product capabilities, geography, and go-to-market strategy. SAM is a mirror of real-life limitations like distribution, language, regulations, and customer fit. It assists in demonstrating where your business can compete.
Serviceable Obtainable Market (SOM)
SOM is the most realistic and practical of the three. It is the portion of SAM that you can reasonably obtain during a specified time, typically the following one to three years. SOM considers competition, budget, execution capacity, and sales potential. This is the figure that is most directly related to your revenue goals and growth strategy.
Collectively, these measures respond to three practical questions:
-
What is the size of the overall opportunity?
-
Which of those markets can we serve?
-
What portion can we possibly obtain?
Why Market Sizing Matters Beyond Investor Pitches
While TAM, SAM, and SOM are standard in fundraising conversations, their value goes well beyond investor presentations.
Market size is critical in Product Development Decisions. When your SOM indicates a small near-term opportunity, you can put more emphasis on features that enable you to grow your SAM or concentrate more on a lucrative niche. Market sizing assists product teams in developing products with a commercial value in mind.
Pricing Strategy is also more evident when you know your market. A smaller SOM with high willingness to pay can be used to justify premium pricing, whereas a larger but price-sensitive market can be served by a volume-driven model. Market size assists in pricing with greater confidence.
Resource Allocation is more feasible when it is linked to the SOM rather than the TAM. The amount of money you spend on marketing, the number of people you hire to sell, the number of people you hire to support customers, and the operations should be based on the market you can actually win, not the one you see on a full scale.
Competitive Strategy is also made sharper. The computation of SOM forces compels founders to be truthful about competition. When a few established players already control your target segment, then the market that you can get is less than it might seem initially. This defines your positioning, message, and entry strategy.
Market sizing can often help in determining when to pivot or persist. When your TAM is too small to accommodate your business objectives, or your SAM is too small to scale effectively, that can be an indication that you need to reposition, grow, or reconsider the model sooner rather than later.
The Two Approaches: Top-Down vs. Bottom-Up
Market size can be calculated in two common ways, and the most powerful founders employ both.
The top-down methodology begins with general market data and filters it down with assumptions and filters. You start with the overall industry size as reported, and divide it into categories, geography, type of customer, or product relevance.
For example:
The global SaaS market is 200 billion, enterprise resource planning is 15% of that (30 billion), and our target market of mid-market manufacturers is 20% of ERP (6 billion SAM).
This technique is practical in context and speed, but tends to be based on assumptions. Otherwise, it may be too general or too specific.
Bottom-Up Methodology starts from the customer level. You estimate the number of potential customers that match your ideal profile, how much they would pay, and what that would translate to in revenue.
For example:
North America has 45,000 manufacturing firms with 100-500 employees, and our target customer spends an average of 50,000 a year on ERP software, which is a 2.25 billion SAM.
Investors tend to use bottom-up calculations as they demonstrate a better knowledge of the market. This is a strategy that is more customer-based and pricing-validated than general assumptions.
The most effective market sizing tends to be a combination of the two approaches. When your top-down and bottom-up numbers are not too far apart, your estimates are far more plausible. When they vary greatly, then it is usually an indication that your assumptions require further development.
How to Calculate Your TAM
The first step to calculating Total Addressable Market is to define your largest possible market and estimate the total revenue potential.
Start by determining all the potential customers who may be interested in your product or service. At this point, you are not filtering by geography, budget, or operational boundaries. TAM is supposed to reflect the entire market before the imposition of constraints.
The simple equation is:
TAM = Total Potential Customers x Annual Revenue Per Customer.
In the case of a SaaS company that provides project management software, TAM may encompass all businesses in the world that use or may use project management tools. Assuming that research indicates that 4.5 million businesses use such software globally and they spend an average of 15,000 a year, the TAM would be 67.5 billion.
In the case of physical products, it is calculated as total units sold per year times average selling price. An example of a high-end athletic footwear company could sell 300 million pairs annually around the world at an average price of 80, making the TAM 24 billion.
In the case of service businesses, TAM can be founded on the annual category expenditure. An example of a B2B marketing agency can estimate that every year, businesses worldwide spend $350 billion on marketing services.
The most significant guideline in computing TAM is to employ plausible and justifiable data. Avoid inflating TAM by including unrelated adjacent markets. Having a big but unrealistic TAM tends to undermine your credibility instead of making it stronger.
How to Calculate SAM?
Serviceable Addressable Market is the part of TAM that your business is capable of serving.
In order to compute SAM, use the practical filters that define your real business model. These may include:
• Geography
• Product limitations
• Target customer profile
• Distribution reach
• Regulatory constraints
• Language or infrastructure needs.
The formula is:
SAM = Potential Customers (qualified) x Annual Revenue Per Customer.
The term here is qualified. These are the customers who are not only present in the market but are also within reach and serviceable by your business.
Still on the same project management SaaS example, assume that your product is designed to suit small to mid-sized businesses in English-speaking markets. Assuming that 35% of the world market fits that description, that can give you 1.6 million relevant businesses. Your SAM is now 24 billion at the same annual expenditure of 15,000.
In the case of athletic footwear, assuming that the company serves North America only and deals in premium products, research may indicate that 50 million pairs of premium shoes are sold every year in the region. That would make a $6 billion SAM.
The trick is to use filters that represent actual business constraints, rather than artificial constraints, to make your eventual market share appear larger. SAM must mirror where you can compete today.
How to Calculate SOM?
The most realistic and most examined figure is the Serviceable Obtainable Market since it is what your business can actually accomplish.
SOM is not merely a demand thing. It is influenced by competition, marketing capacity, sales execution, customer acquisition cost, team size, and time.
The simple equation is:
SOM = SAM x Realistic Market Share in 1-3 Years.
It is here that most founders get over-optimistic. An SOM must be realistic, not an idealistic view of what can be done.
In the case of early-stage startups, SOM can be small. Most B2B startups aim to reach 0.5% to 2% of SAM within the first year, and could grow to 5% to 10% over a few years, assuming traction, funding, and execution.
Going back to the project management SaaS example, assuming that your SAM is 24 billion and you project that you will capture 1 percent in three years, your SOM would be 240 million.
That is a good chance, yet it is based on what is really possible.
Current businesses can calculate SOM based on the current performance, sales trends, and expansion plans. When you already have 2% of your SAM and are increasing steadily, your SOM must indicate a realistic extension of that increase.
The largest SOM error is to think that your company can capture market share as though there are no competitors. As a matter of fact, you are getting into a market where attention, trust, and customer budgets are already being competed for. A realistic SOM recognizes that.
Presenting Market Size in Pitch Decks
The way you package TAM, SAM, and SOM can be nearly as important as the numbers themselves.
Investors look through a great number of decks, and clarity is important. The most effective way is to have a simple visual that clearly demonstrates the relationship between the three. A funnel, stacked chart, or nested circle format tends to be effective.
Under each number, add:
• The market size
• The key assumptions
• Where did you get your information?
Powerful sourcing is credible. Gartner, Forrester, Statista, government data, industry associations, and market research firm reports are likely to have greater weight than random blog estimates or unattributed figures.
More to the point, your market sizing must have a story to tell:
• TAM demonstrates the size of the industry.
• SAM demonstrates the position of your product.
• SOM demonstrates what your business is capable of capturing.
This makes it a far more convincing and investor-friendly story.
Common Market Sizing Mistakes to Avoid
Even powerful founders tend to make preventable errors in market sizing.
One of the most frequent is the confusion of TAM with revenue potential. TAM is not your estimated income. It is the entire market potential, not your probable success.
Only top-down analysis may also undermine your credibility. Investors will be interested in knowing that you have counted actual customers and justified pricing, not duplicated industry numbers.
Competition is ignored in the calculation of SOM, which makes the projections appear out of touch with reality. When there are already players who are established, then the market that you can get is naturally smaller.
Red flags are also caused by geographic mismatches. In the case that your business is already in operation in a single region, your SAM and SOM must be based on that, although your TAM may be global.
The picture can be skewed by using old or inaccurate data. Where possible, market size must be pegged on recent and similar data points.
It is too early to claim unrealistic market share and make the whole model appear weak. Conservative assumptions tend to be more realistic and tend to be more practical in planning.
Market Sizing for Different Business Models
Market sizing needs a slightly different approach in different business models.
SaaS and subscription businesses are to target the potential of annual recurring revenue, retention, churn, and contract value.
Marketplaces and platforms must consider both sides of the market. A marketplace can be in demand by both buyers and sellers, but its true potential is usually constrained by the one that is more difficult to obtain.
Logistics, inventory, conversion rates, and customer acquisition costs should be considered by e-commerce and retail businesses when transitioning to SOM.
The hardware and physical product companies must also take into consideration the manufacturing capacity, distribution channels, and supply constraints in estimating what they can realistically capture.
Using Market Sizing for Strategic Decisions
After you have computed TAM, SAM, and SOM, these figures must not only affect your pitch deck.
When SAM is too small, you might have to consider ways of increasing it. That may be to venture into new markets, to serve more customer segments or to expand your product range.
In case SOM shows that there is a lot of competition, you might want to reconsider your positioning or target a less served niche.
When TAM is big and SAM is small, it might not be a demand problem, but your existing business model. This can be enhanced by improved distribution, product expansion, or alliances.
When applied properly, market sizing assists founders in making more acute strategic choices, rather than superior slides.
Final Words
TAM, SAM, and SOM are not just startup jargon. They are useful instruments that assist founders to comprehend the entire size of an opportunity, the portion they can actually serve, and the portion they can actually capture. These metrics aid in improved decision-making in products, pricing, hiring, growth, and fundraising when computed appropriately. They also demonstrate to investors that you are not merely pursuing a large market, but that you know precisely where your business belongs in the market.
However, identifying the right target audience and effectively capturing substantial market share largely depends on brand visibility and positioning. This is where a digital marketing agency comes in; they can not only help businesses refine their strategy but also guide them in improving their online reach and transforming market potential into real growth through performance marketing, social media management, and search engine optimization services.
FAQs
Q1. What is the difference between TAM, SAM, and SOM?
TAM (Total Addressable Market) represents the entire market opportunity. SAM (Serviceable Addressable Market) is the portion of your business that you can realistically serve. SOM (Serviceable Obtainable Market) is the market share you can realistically capture in the near term.
Q2. Why are TAM, SAM, and SOM important for startups?
These metrics help founders understand the size of their opportunity, make informed product and pricing decisions, allocate resources effectively, and set realistic growth targets. Investors also use them to assess market potential and execution credibility.
Q3. Should I use top-down or bottom-up methods to calculate market size?
Both. Top-down estimates provide quick context from industry reports, while bottom-up calculations are based on actual customer data and unit economics. Combining both increases credibility and helps validate assumptions.
Q4. Can TAM, SAM, and SOM change over time?
Yes. Markets evolve, competition shifts, and your business capabilities grow. Regularly revisiting these metrics ensures your strategy and projections remain realistic and actionable.
Q5. How do I avoid common market sizing mistakes?
Use credible data, clearly document assumptions, differentiate between TAM and achievable revenue, consider competition, and ensure SAM and SOM reflect realistic operational constraints rather than idealized scenarios.
Author
A
Aijaz Mughal
Mr. Aijaz Mughal is a trusted advisor and thought leader in digital marketing and business growth with over 20 years of extensive experience. Throughout his illustrious career, he has had the privilege of working with top-tier brands such as Emaar, Masdar, Honda, Leejam, Unilever, The Dubai Mall, Emerson, Moorfields, and Yamaha, where he has made significant contributions to their digital marketing success.
Speak to an Expert